

By Jason Ifraimov, The Next Step Group | Published October 2026
The York Region housing market spent all spring building momentum. More sales every month, homes selling faster, sellers getting closer to asking. September was supposed to carry that into fall. It didn't.
Sales dropped for the third month in a row, homes are taking as long to sell as they did a year ago, and prices are down 3.7% from last year. This report covers all of York Region, including Vaughan, Woodbridge, Maple, Kleinburg, Thornhill, Richmond Hill, Markham, Aurora, Newmarket and King City.
September 2026 at a glance
Sales: 893, down 13.5% from September 2025
Average price: $1,136,650, down 3.7% ($44,115 less than a year ago)
Days on market: 56, the same as last September and up from 43 in April
New listings: 3,106, down 11.6%
Market balance: buyer's market, with a sales-to-new-listings ratio of 35.8%
York Region home sales are down 13.5% from last year
York Region recorded 893 home sales in September, down from 1,032 a year ago. That's the third straight monthly drop (1,063 in July, 971 in August) and 30.7% below June's high of 1,289.
Some of that is seasonal. Not all of it. Last year, September beat August. This year sales fell 8%. July to September combined, sales are down 4.8% from 2025.
Year to date, York Region is still up 3.2% (8,517 sales vs. 8,251). The first half of 2026 was stronger. The back half is giving it back.
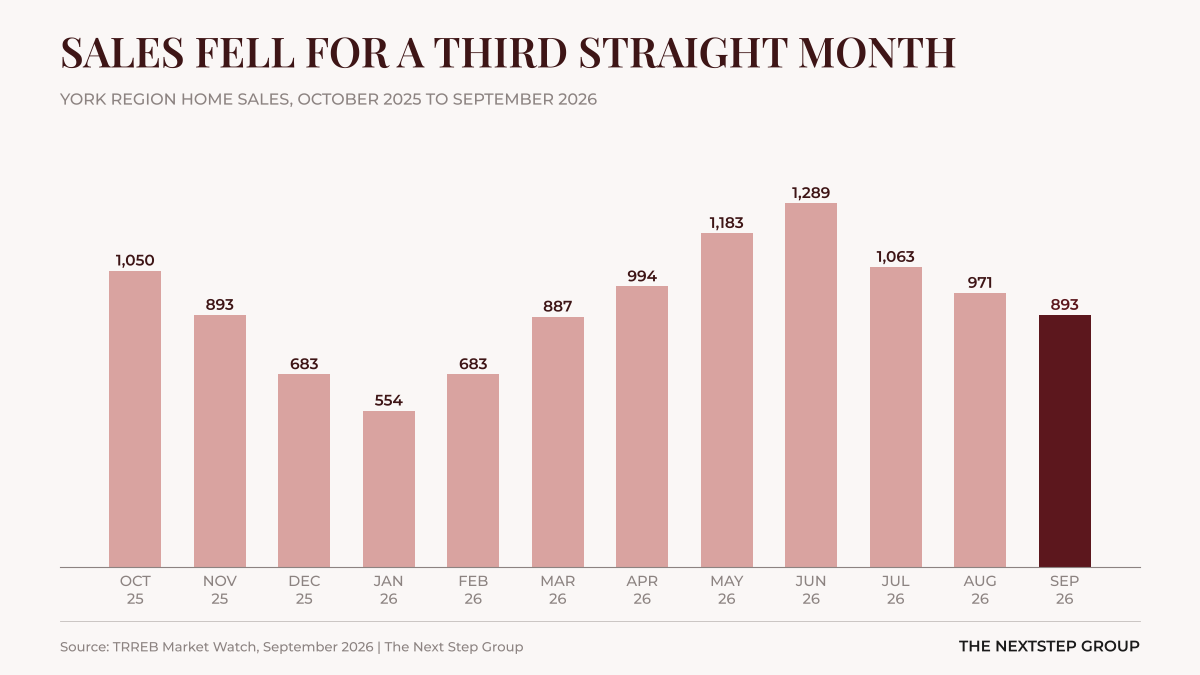
York Region home sales by month from October 2025 to September 2026, peaking at 1,289 in June and falling to 893 in September 2026
York Region home prices are down 3.7% from last year
The average York Region home sold for $1,136,650 in September, down $44,115 from $1,180,765 a year ago. The median price was $1,043,000, down 4.1%.
Month to month, prices have been choppy, not trending: $1,146,307 in July, $1,179,938 in August, $1,136,650 in September. No collapse, no recovery.
Zoom out and the average price is 28.4% below the February 2022 peak of $1,587,603. GTA-wide, prices are down 5.0%, so York Region is holding up slightly better on price. Not on sales: down 13.5% here vs. 9.9% GTA-wide.
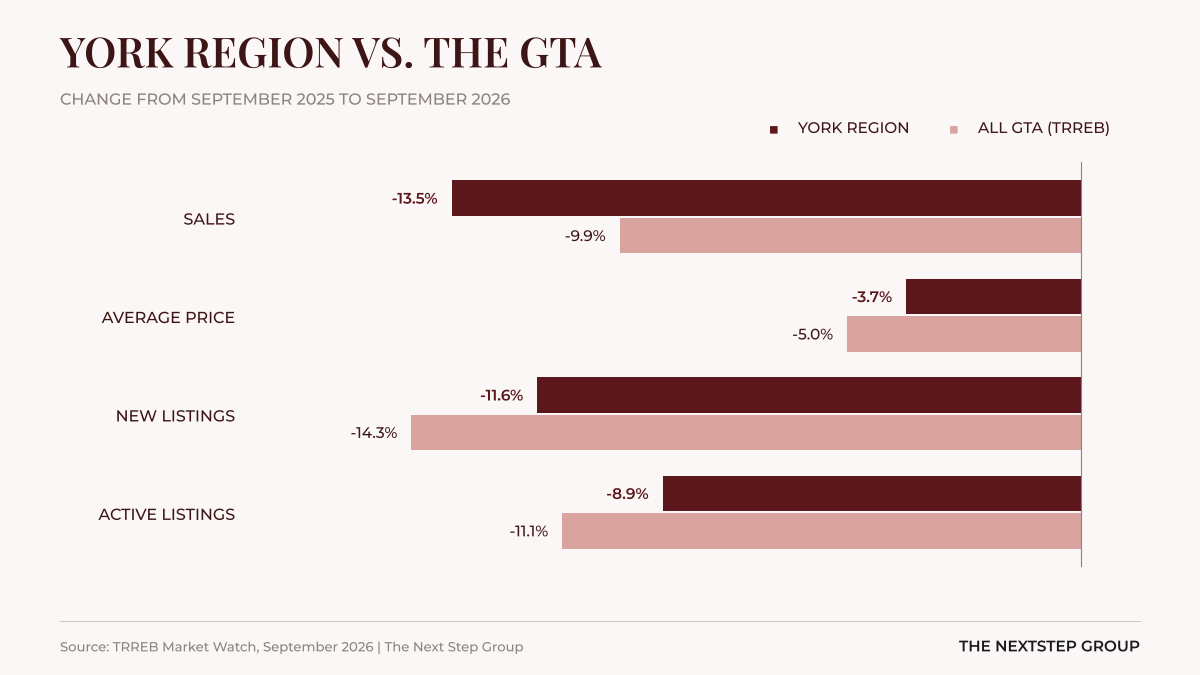
York Region vs GTA year-over-year change in September 2026 for home sales, average price, new listings and active listings
York Region homes are taking 56 days to sell
PDOM (property days on market) is the real number. It counts the full time a home has been for sale, even if it was relisted to reset the clock. It went from 52 days in July to 55 in August to 56 in September. In April it was 43.
That's exactly where it sat last September. The spring improvement is gone.
The 18-day gap between listed days on market (38) and PDOM (56) tells you a lot of sellers are relisting to look fresh. Buyers check the history. It rarely works.
Homes sold for 97% of asking on average, down from 98% last September. On a $1,136,650 home, one point is more than $11,000 off the table.
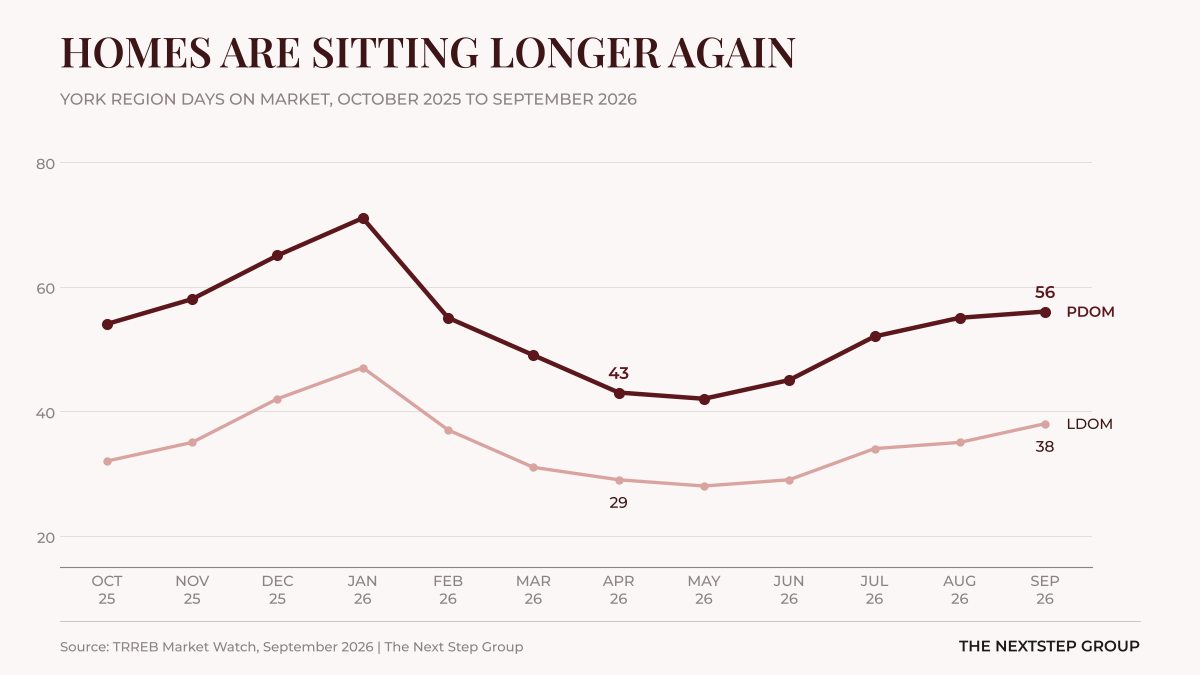
York Region days on market from October 2025 to September 2026, with PDOM rising from 43 days in April to 56 days in September 2026
York Region sellers pulled back 11.6%
New listings came in at 3,106, down 11.6% from 3,515 last September. Active listings sat at 5,168, down 8.9%.
New listings did jump 30% from August, but that happens every September. What matters: there's less supply than a year ago, and it still isn't moving faster.
York Region is still a buyer's market, 21 months running
The sales-to-new-listings ratio (SNLR) is 35.8%. Under 40% is a buyer's market, 40% to 60% is balanced, over 60% favours sellers. York Region has been under 40% every month since January 2025. Months of inventory sits at 5.0.
SNLR has crept up from 31.5% in January, which looks like tightening. Look closer: sales and listings are both down. The ratio is rising because sellers are stepping back, not because buyers are rushing in.
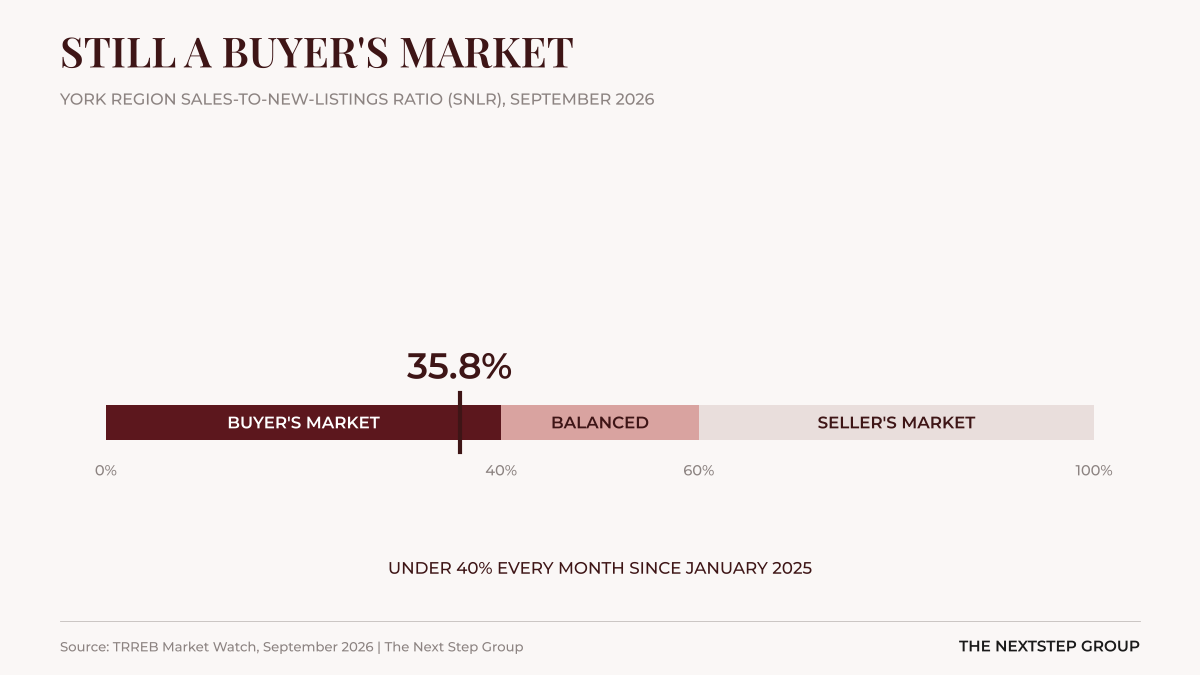
York Region sales-to-new-listings ratio of 35.8% in September 2026, inside the buyer's market range below 40%
York Region at a glance: September 2026 vs. September 2025
What this means for you
Buyers: 5,168 active listings and 56 days on market is leverage. Your move: focus on homes past the 30-day mark. That's where sellers are most open on price and conditions.
Sellers: Price for the market you're in, not the one from spring. Your move: if you've been sitting 30+ days, adjust the price before you relist. Not sure where you stand? Start with a free home evaluation.
Move-up families: You're selling and buying in the same market. If your sale comes in light, the bigger home is priced under the same conditions. Your move: get a real number on your current home first, then shop.
The honest risk: if fall demand stays this soft, prices could drift lower into winter. Last year the low point came in January, when the average price hit $1,110,582. I'm not calling a bottom yet.
York Region housing market FAQ
Is York Region a buyer's market right now?
Yes. The sales-to-new-listings ratio was 35.8% in September 2026, below the 40% line for a buyer's market, and it has been under that line every month since January 2025. Months of inventory sits at 5.0.
Are home prices going down in York Region?
Year over year, yes. The average price is down 3.7% to $1,136,650 and the median is down 4.1% to $1,043,000. Month to month, prices have moved sideways since July rather than falling steadily.
What's happening in the Vaughan housing market?
This report tracks York Region as a whole, including Vaughan, Woodbridge, Maple, Kleinburg and Thornhill. Region-wide, prices are down 3.7% and homes are taking 56 days to sell. For your street, get a free home evaluation.
How long does it take to sell a house in York Region?
56 days on average in September 2026, measured by PDOM, which counts the full time on market including relists. That's the same as September 2025 and up from 43 days in April.
Is now a good time to sell a house in York Region?
It depends on your next move. Homes are selling at 97% of asking and sitting 56 days, so pricing right from day one matters more than timing. If you're also buying, the same conditions work in your favour.
Want to know what this means for your home?
Whether you're in Vaughan, Richmond Hill, Markham, Newmarket, Aurora or King City, if you're planning a move in the next 6 to 12 months, book a quick call or get a free home value estimate.
Book a call | Get your home value
Jason | The Next Step Group
Source: TRREB Market Watch, September 2026 | The Next Step Group. All figures are York Region totals unless noted as GTA-wide.